Loss Forecast
Linear Regression
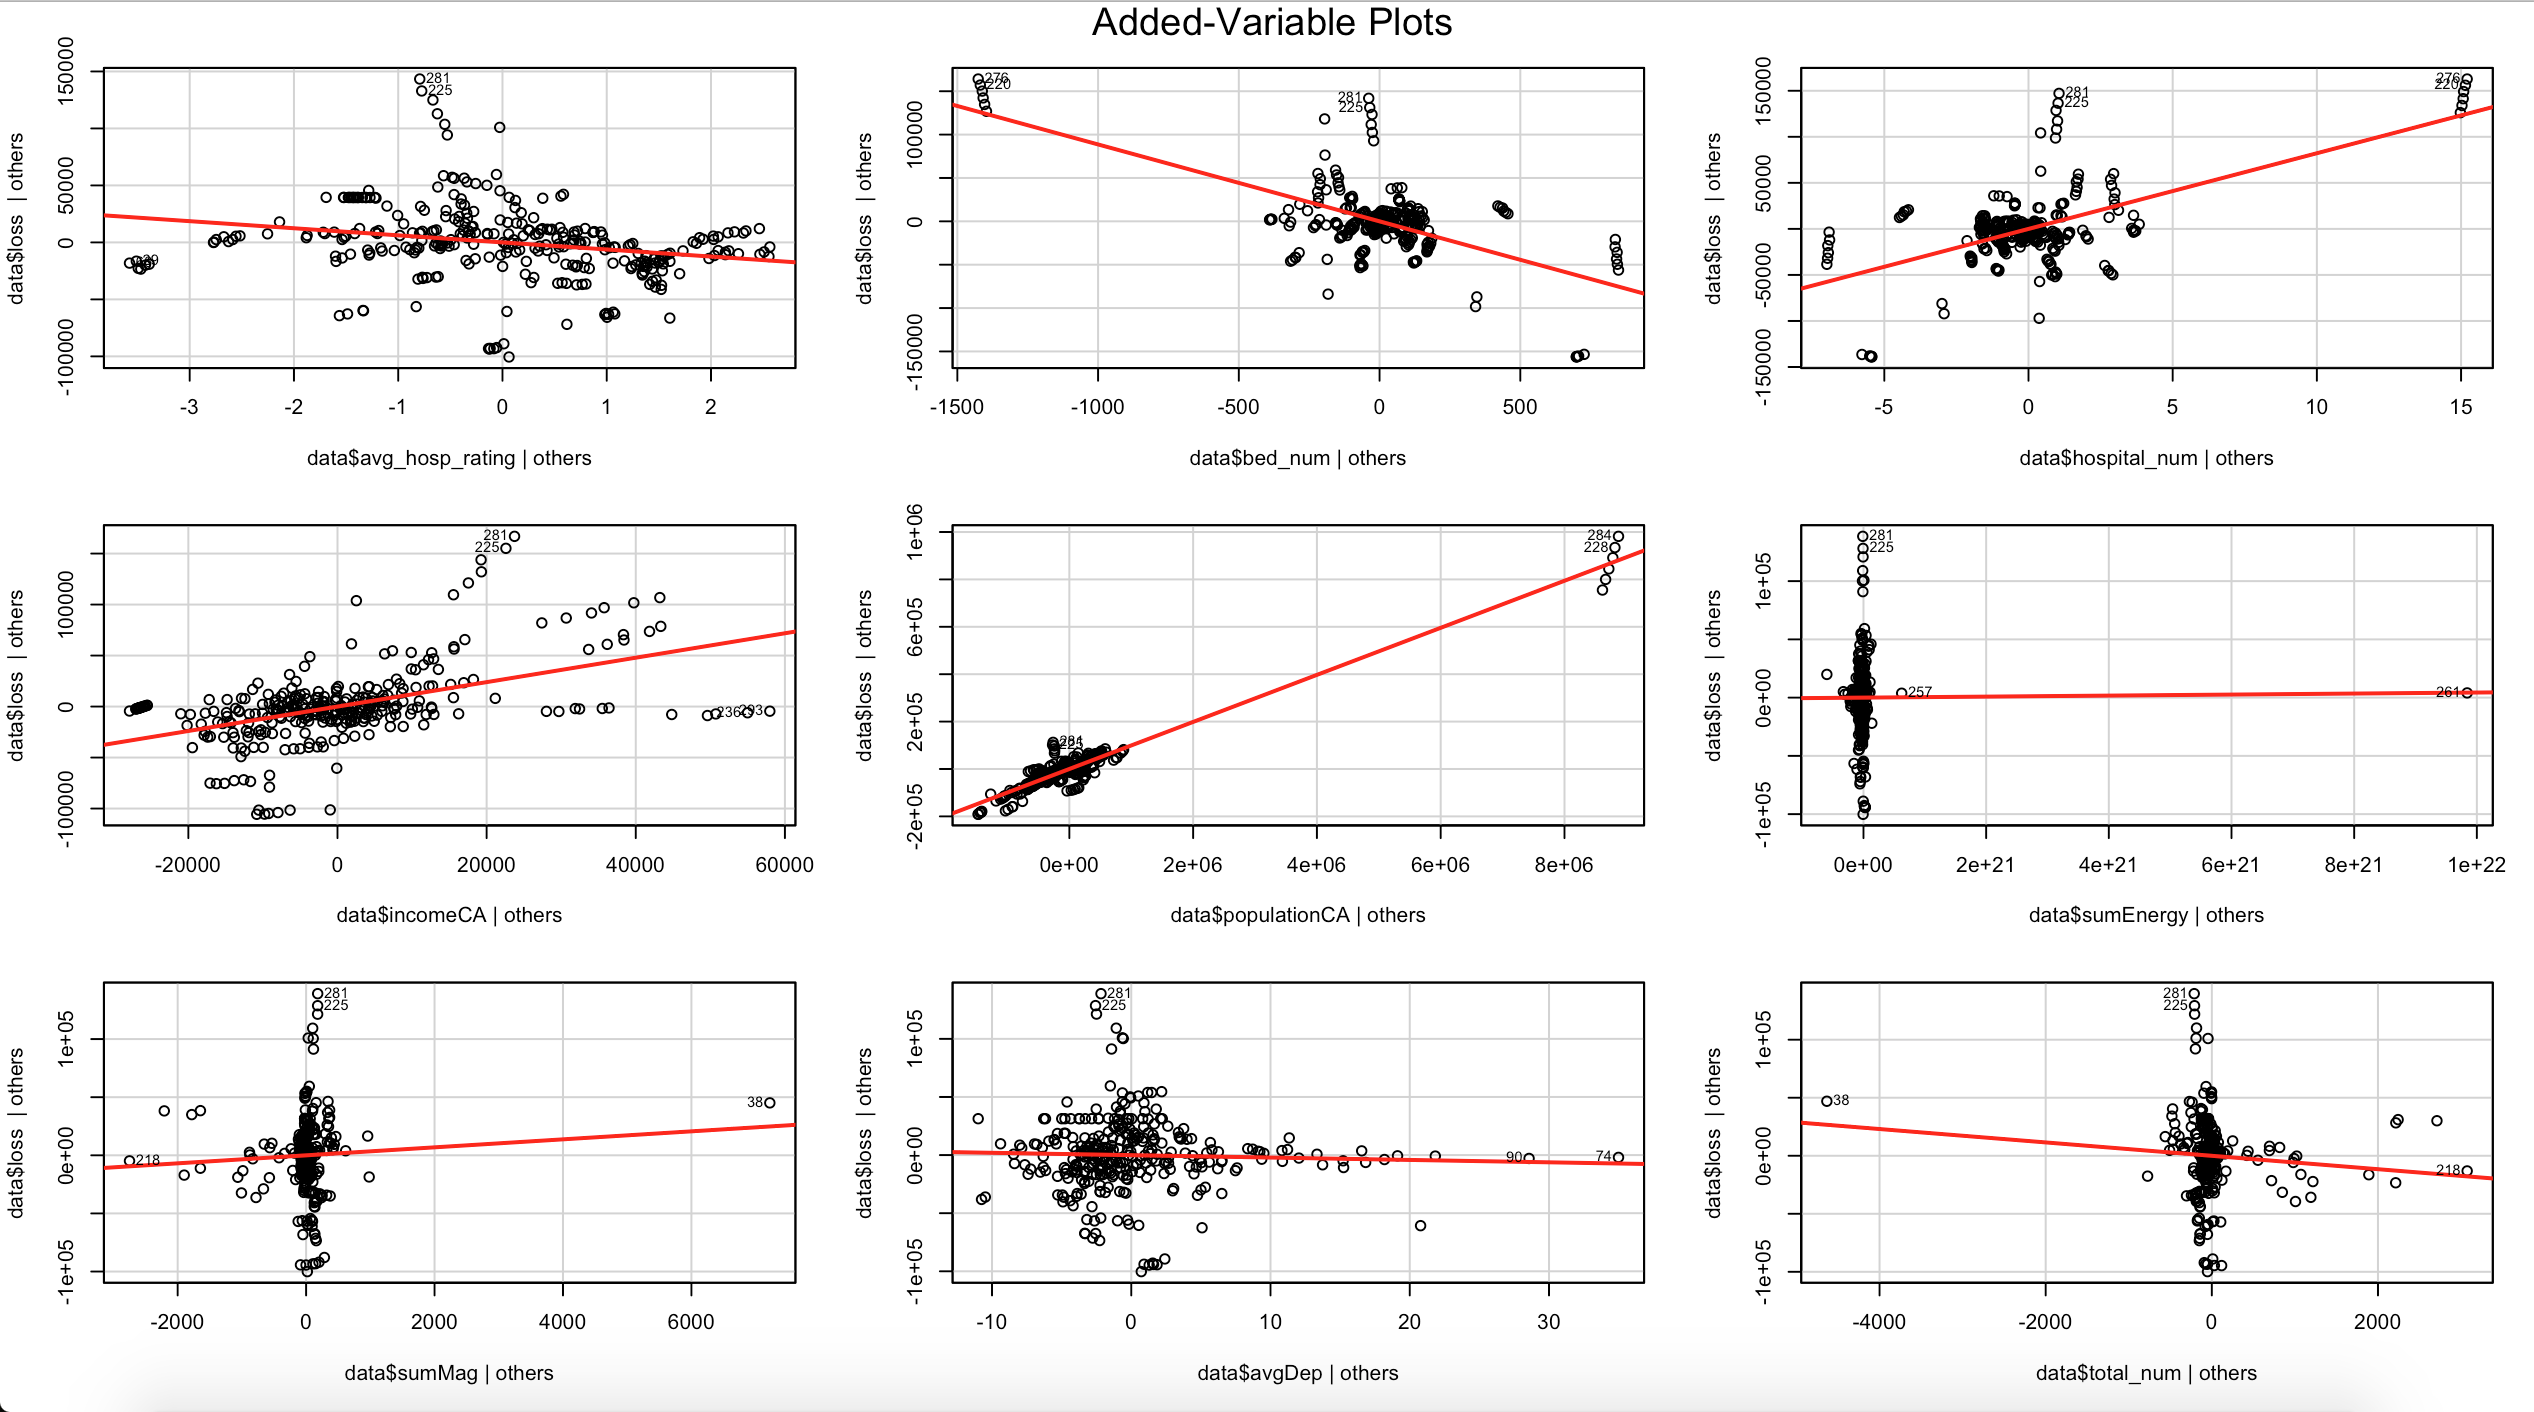
In our linear regression model, we consider both robust regression and ridge regression,because there are some missing value in the original data(since in some year, some counties only have one or two times of earthquake, then loss could be very small or even missing), so robust regression could avoid this problem. Since sumEnergy could be very large, we also use ridge regression to balance square error and absolute error, we finally get a more reasonable linear regression model and evaluate each of the parameter, the result shows income and medical situation in county level could be very influential on economic loss, since in most cases, the earthquake intensity are under 7 degree, which will not cause much building destroying.
Neural Network
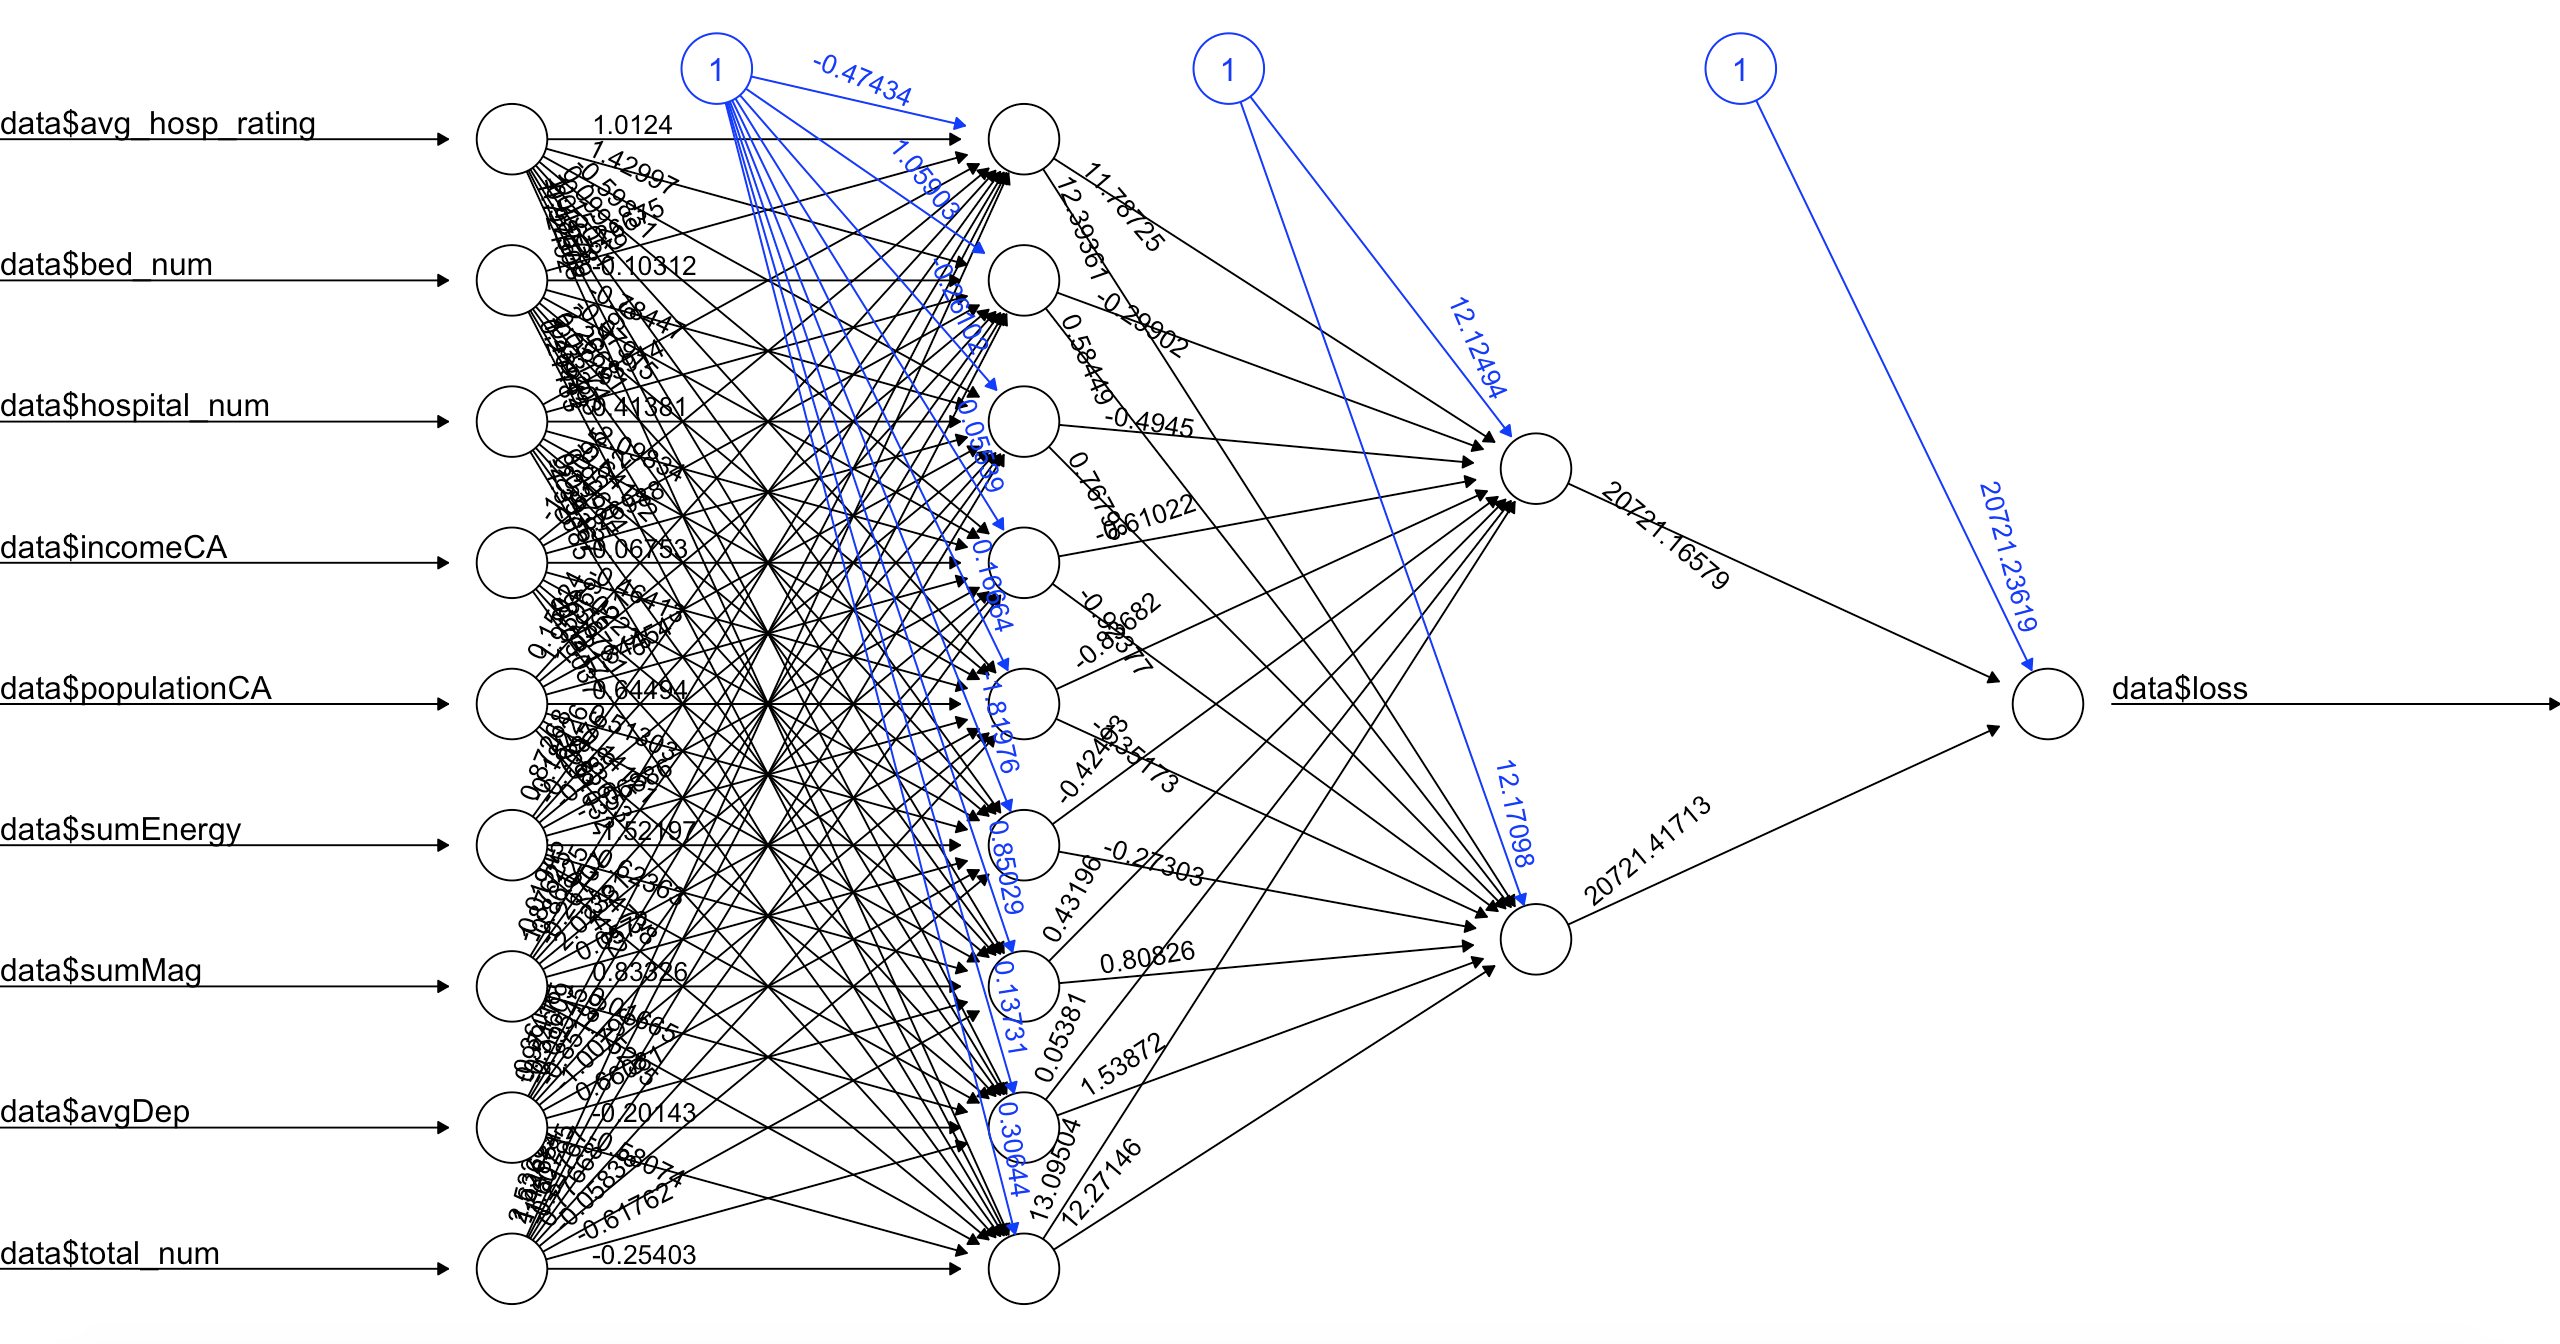
In our Neural Network construction, we use two hidden layer, first hidden layer has 9 neurons and the second has 2 neurons, we train our model by using backpropagation algorithm. After tunning our model, we finnally determine parameters in neural network: learning rate is 0.7(which can also be tuned in the trainning procedure by model itself), using "Tanh" function as activation function, and using entrophy function as loss function. We also preclassify our loss test data into 5 classes, and tested result in our trained network, the result shows we can reach 85% accuracy, and confusion matrix presents relative incorrectly classified instances.
Support Vector Machine
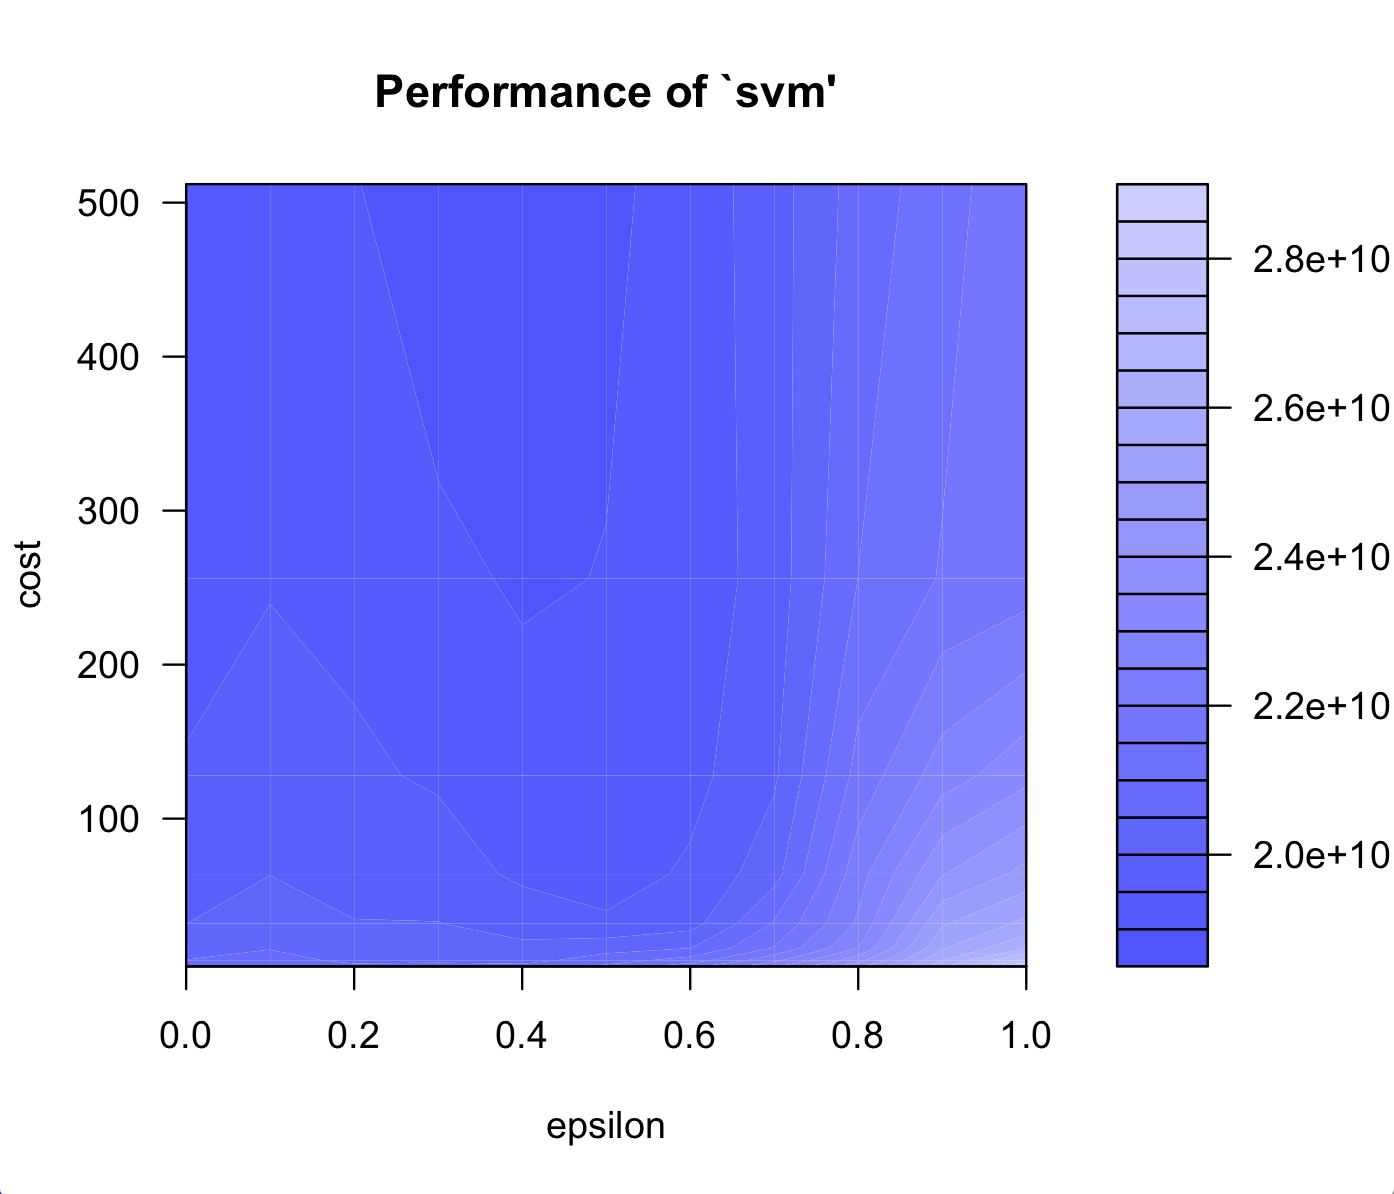
We use support vector machine to do regression of our data, support vector machine is very specific class of algorithm, characterized by usage of kernels, absence of local minima, sparseness of the solution and capacity control obtained by acting on the margin, or on number of support vectors. In our experiment, we choose gaussian kernel, specific meta-parameters parameters C, and epsilon. We evaluate the performance of two most import attributes: County income and total number of earthquakes, which confirm its influence on loss. We also tune the svm result by factors' importance. The figure shows the importance of income and total number of earthquakes.
Random Forest
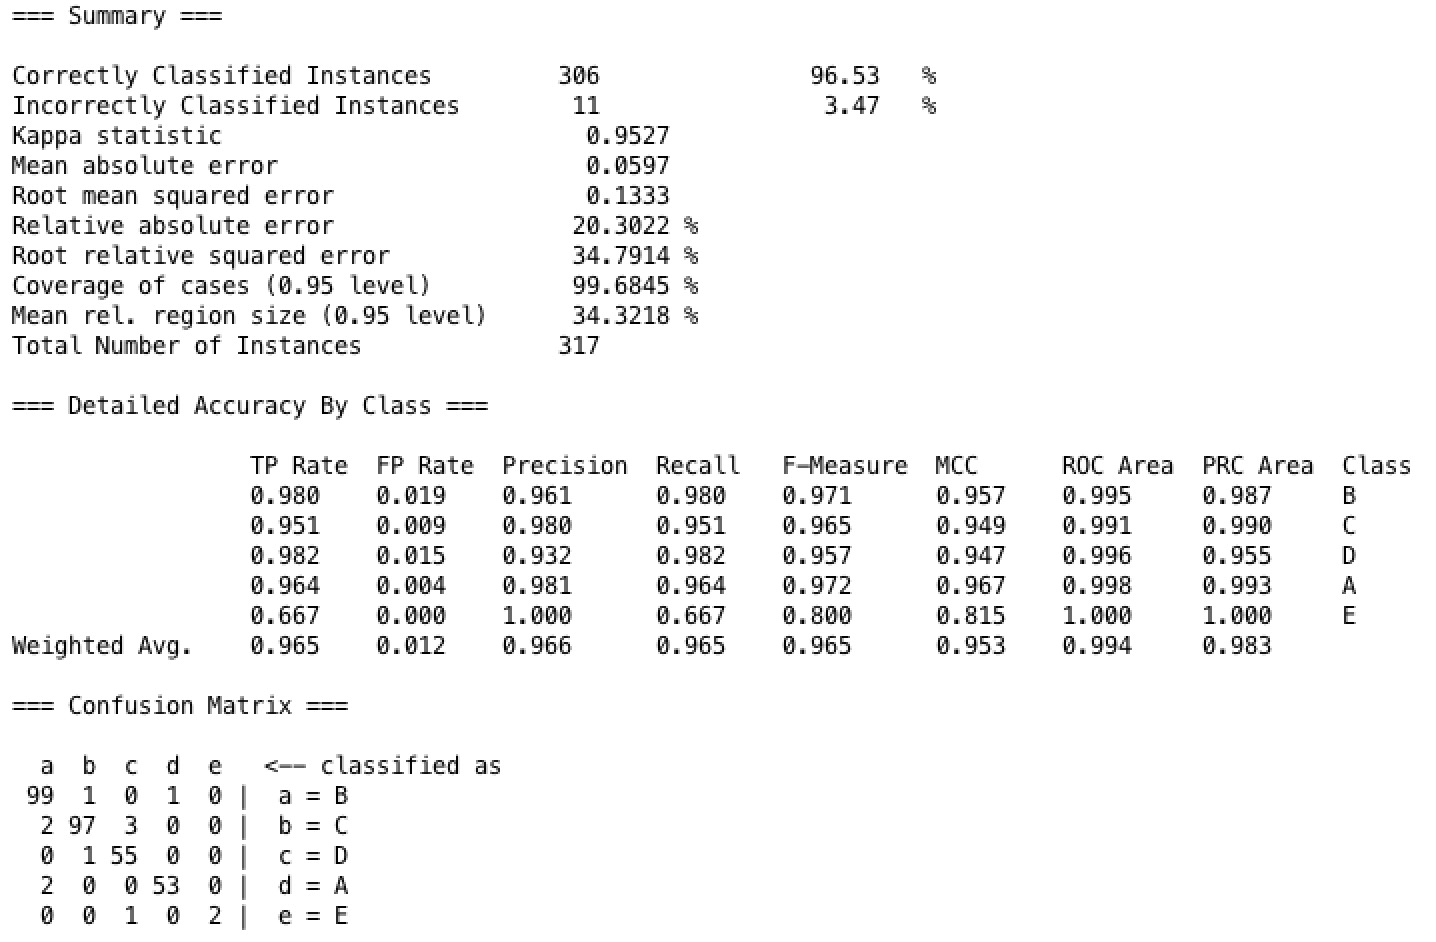
In our Random Forest model, with different configuration of model we have tried on our dataset, we have finally tuned to model to the following parameter setup: Use 100 trees while each tree uses three features, and each tree has a max depth of one. This model results in the highest accuracy among all our models when running on our dataset with 10 fold cross validation, which is as high as 96.5%. As shown in the confusion matrix, the result has a weighted average true positive rate as 96.5% and false positive rate as 1.2%.
Decision Tree
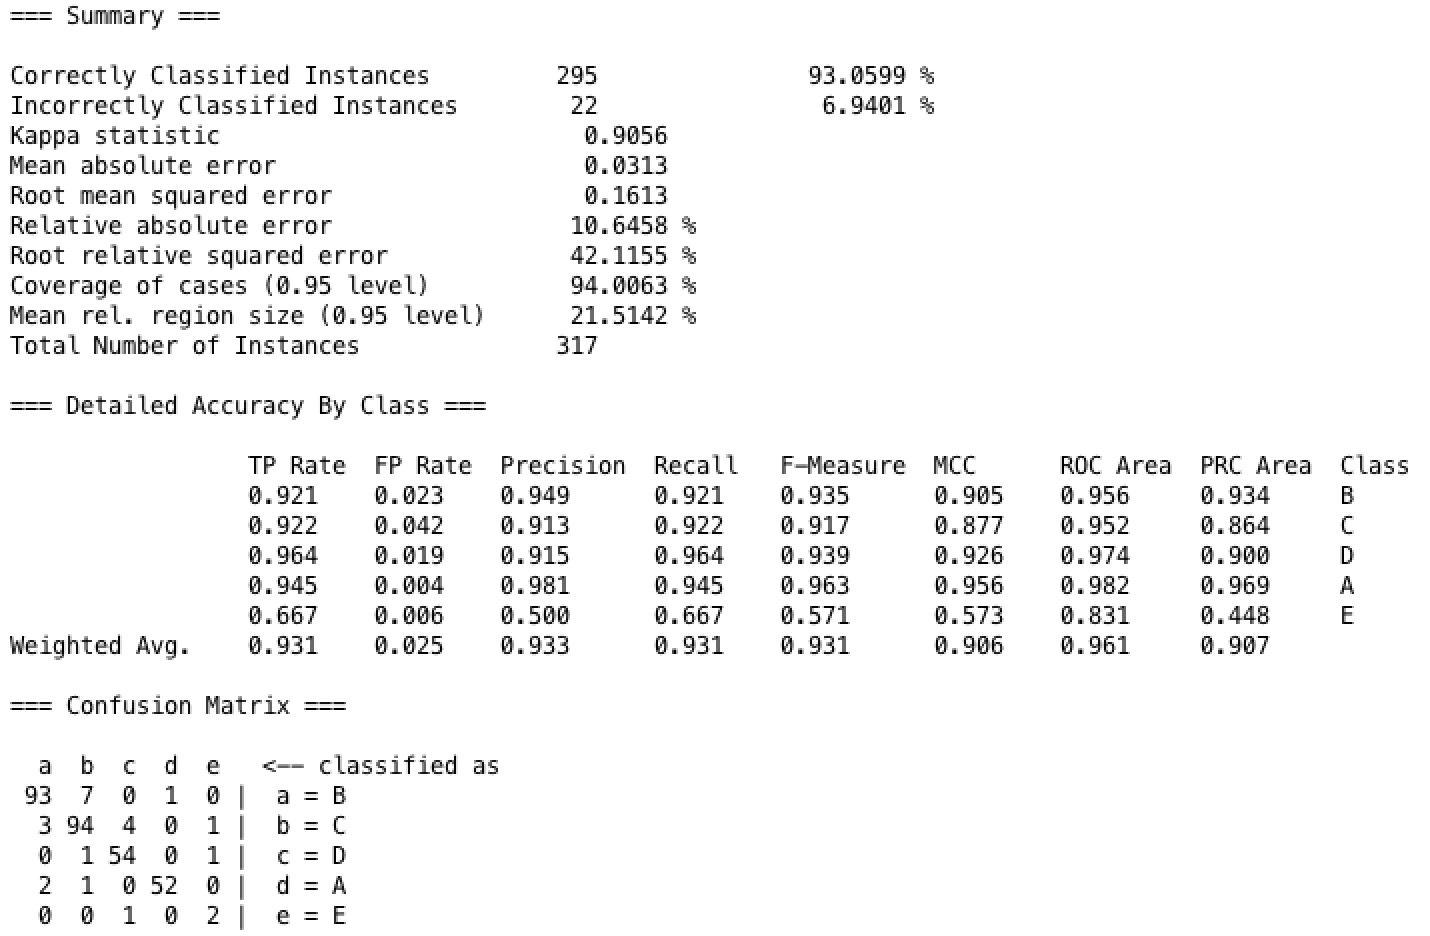
In our Decision Tree model, we used the technique of maximizing information gain to shorten our tree. And we set the confidence factor as 0.25 to prune our tree model. When running our model on our dataset with 10 fold cross validation, we get result of fairly high accuracy. As shown in the confusion matrix, the result has a weighted average true positive rate as 93.1% and false positive rate as 2.5%.
K-Nearest Neighbors
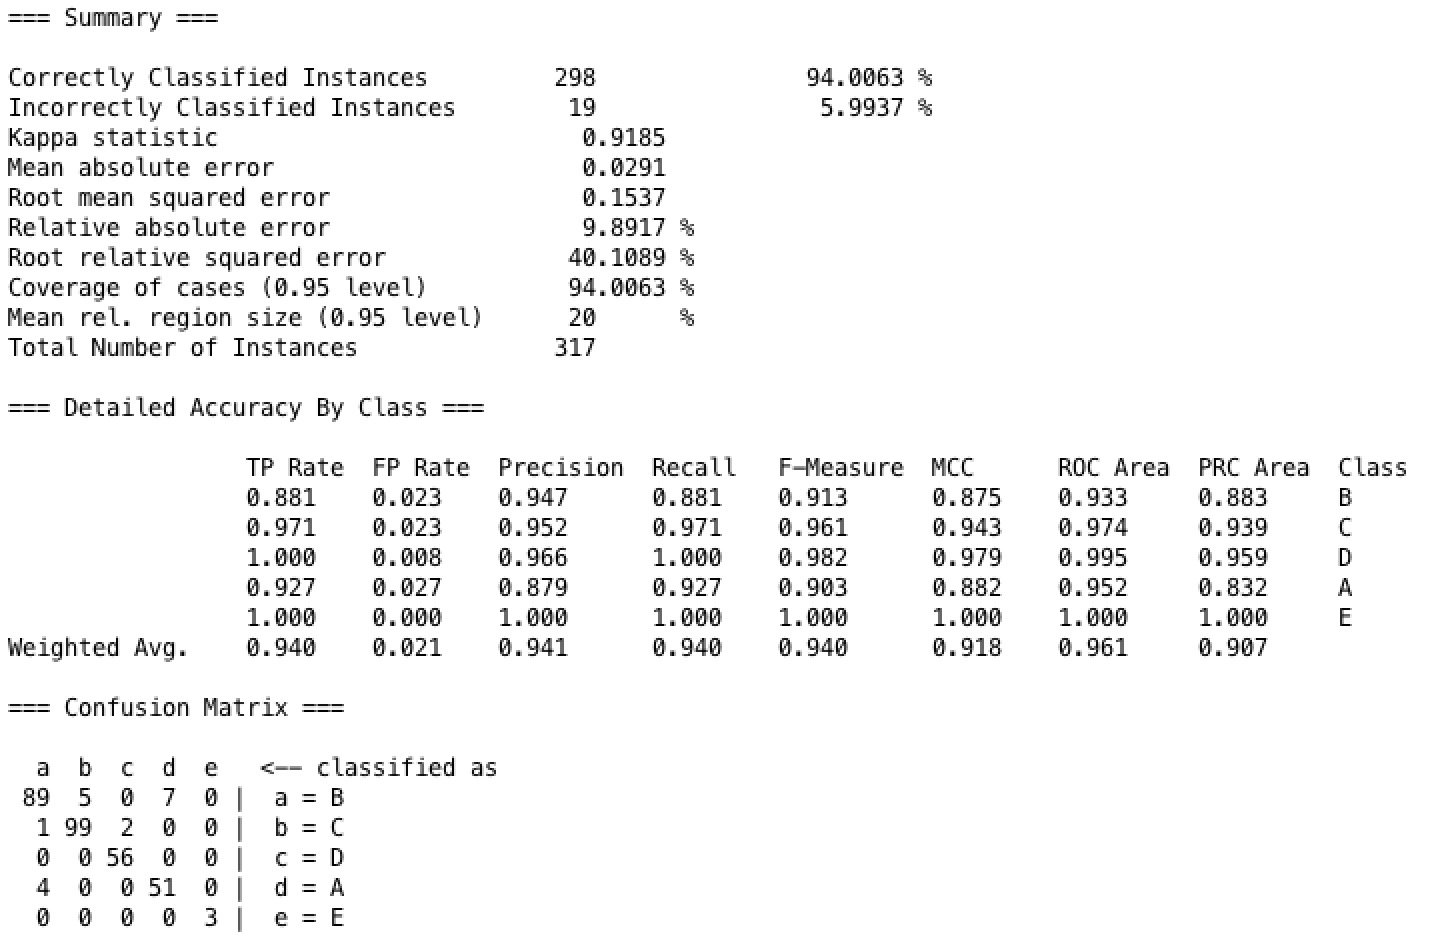
In our k Nearest Neighbor model, we have tried building the model with various k value to test on our dataset, and find that the test with 10 folds cross validation has the highest accuracy when k equals one. And for the nearest neighbor search algorithm we used the linear nearest neighbor search model, with euclidean distance specifically. One biggest advantage of kNN is it builds the model very fast, while the accuracy is nearly as good as the tree models, whose building time is longer than the kNN. As shown in the result, the kNN model's accuracy is 94%.
Naive Bayes
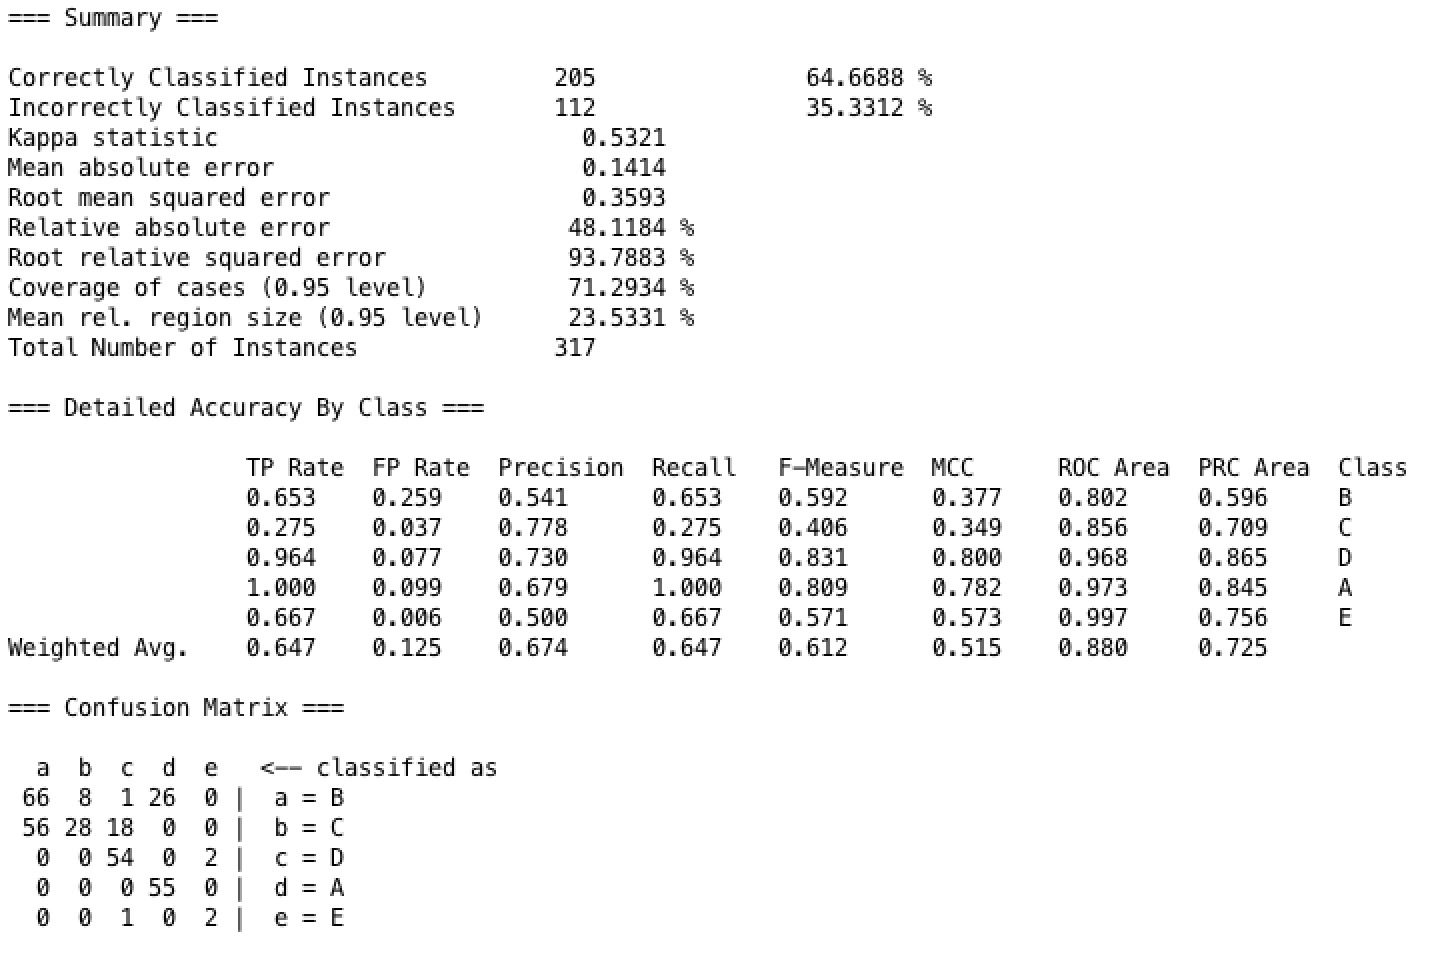
Naive Bayse is a very simple but strong classifier. It performs pretty good on some dataset. But for our dataset, the 10 folds cross validation testing accuracy is relatively low comparing to other classifier models,which is only 64.67%. And as shown in the confusion matrix, the true weighted average positive rate is 64.7%, and false positive rate is 12.5%.